1. Regression
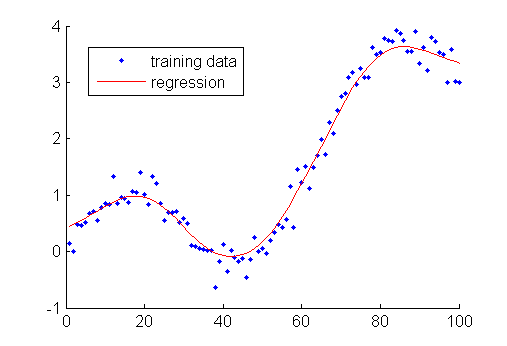
Regression analysis is a form of predictive modelling technique which investigates the relationship between a dependent variable(s) (target) and independent variable(s) (predictor). This technique is used for forecasting, time series modelling and finding the causal effect relationship between the variables. Regression analysis is an important tool for modelling and analyzing data. Here, we fit a curve / line to the data points, in such a manner that the differences between the distances of data points from the curve or line is minimized.
Important
One important fact to note, and one that is often brushed over or forgotten, is that statistical analysis, regression analysis included, can only ever indicate correlations between factors, not causal relationships. Regression analysis is a great technique for making predictions and understanding the influences of variables on one another, but are sometimes misused, or misunderstood, and taken to be a reliable proof of causality, this is misleading. While some of the variables included in a regression model may very well be causally related to one another, they also might not be; without empirical testing, these relationships cannot be taken as absolute.
1.1. Basic Models
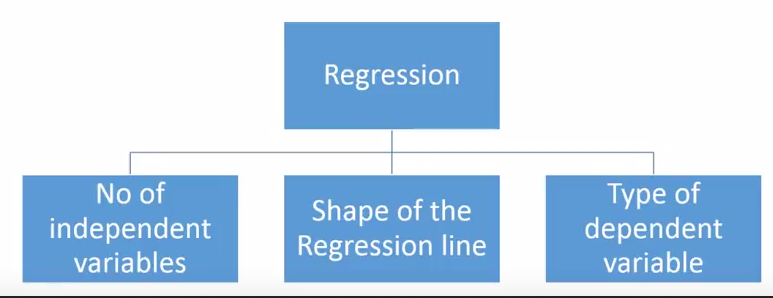
There are various kinds of regression techniques available to make predictions. These techniques are mostly driven by three metrics (number of independent variables, type of dependent variables and shape of regression line).
1.1.1. Continuous variables
Continuous variables are a measurement on a continuous scale, such as weight, time, and length.
1.1.1.1. Linear regression
Linear regression, also known as ordinary least squares (OLS) and linear least squares, is the real workhorse of the regression world. Use linear regression to understand the mean change in a dependent variable given a one-unit change in each independent variable.
- There must be linear relationship between independent and dependent variables
- Multiple regression suffers from multicollinearity, autocorrelation, heteroskedasticity.
- Linear Regression is very sensitive to Outliers. It can terribly affect the regression line and eventually the forecasted values.
- Multicollinearity can increase the variance of the coefficient estimates and make the estimates very sensitive to minor changes in the model. The result is that the coefficient estimates are unstable
- In case of multiple independent variables, we can go with forward selection, backward elimination and step wise approach for selection of most significant independent variables.
1.1.1.2. Polynomial Regression
When we want to create a model that is suitable for handling non-linearly separable data, we will need to use a polynomial regression. In this regression technique, the best fit line is not a straight line. It is rather a curve that fits into the data points.
- Able to model non-linearly separable data; linear regression can’t do this. It is much more flexible in general and can model some fairly complex relationships.
- Full control over the modelling of feature variables (which exponent to set).
- Requires careful design. Need some knowledge of the data in order to select the best exponents.
- Prone to over fitting if exponents are poorly selected.
1.1.1.3. Ridge regression
Ridge Regression is a technique used when the data suffers from multicollinearity ( independent variables are highly correlated). In multicollinearity, even though the least squares estimates (OLS) are unbiased, their variances are large which deviates the observed value far from the true value. By adding a degree of bias to the regression estimates, ridge regression reduces the standard errors.
- It allows you to analyze data even when severe multicollinearity is present and helps prevent overfitting. This type of model reduces the large, problematic variance that multicollinearity causes by introducing a slight bias in the estimates.
- The assumptions of this regression is same as least squared regression except normality is not to be assumed
- It shrinks the value of coefficients but doesn’t reaches zero, which suggests no feature selection feature
- This is a regularization method and uses l2 regularization.
- The procedure trades away much of the variance in exchange for a little bias, which produces more useful coefficient estimates when multicollinearity is present.
1.1.1.4. Lasso regression
Lasso regression (least absolute shrinkage and selection operator) performs variable selection that aims to increase prediction accuracy by identifying a simpler model. It is similar to Ridge regression but with variable selection. Similar to Ridge Regression, Lasso (Least Absolute Shrinkage and Selection Operator) also penalizes the absolute size of the regression coefficients. In addition, it is capable of reducing the variability and improving the accuracy of linear regression models. Lasso regression differs from ridge regression in a way that it uses absolute values in the penalty function, instead of squares. This leads to penalizing (or equivalently constraining the sum of the absolute values of the estimates) values which causes some of the parameter estimates to turn out exactly zero. Larger the penalty applied, further the estimates get shrunk towards absolute zero. This results to variable selection out of given n variables.
- The assumptions of this regression is same as least squared regression except normality is not to be assumed
- It shrinks coefficients to zero (exactly zero), which certainly helps in feature selection
- This is a regularization method and uses l1 regularization
- If group of predictors are highly correlated, lasso picks only one of them and shrinks the others to zero
1.1.1.5. ElasticNet Regression
ElasticNet is hybrid of Lasso and Ridge Regression techniques. It is trained with L1 and L2 prior as regularizer. Elastic-net is useful when there are multiple features which are correlated. Lasso is likely to pick one of these at random, while elastic-net is likely to pick both. A practical advantage of trading-off between Lasso and Ridge is that, it allows Elastic-Net to inherit some of Ridge’s stability under rotation.
- It encourages group effect in case of highly correlated variables
- There are no limitations on the number of selected variables
- It can suffer with double shrinkage
1.1.2. Categorical variables
A categorical variable has values that you can put into a countable number of distinct groups based on a characteristic.
1.1.2.1. Binary Logistic Regression
Use binary logistic regression to understand how changes in the independent variables are associated with changes in the probability of an event occurring. This type of model requires a binary dependent variable. A binary variable has only two possible values, such as pass and fail.
1.1.2.2. Ordinal Logistic Regression
Ordinal logistic regression models the relationship between a set of predictors and an ordinal response variable. An ordinal response has at least three groups which have a natural order, such as hot, medium, and cold.
1.1.2.3. Nominal Logistic Regression
Nominal logistic regression models the relationship between a set of independent variables and a nominal dependent variable. A nominal variable has at least three groups which do not have a natural order, such as scratch, dent, and tear.
1.1.2.4. Poisson regression
Use Poisson regression to model how changes in the independent variables are associated with changes in the counts. Poisson models are similar to logistic models because they use Maximum Likelihood Estimation and transform the dependent variable using the natural log. Poisson models can be suitable for rate data, where the rate is a count of events divided by a measure of that unit’s exposure (a consistent unit of observation).
1.2. Selecting Model
Within multiple types of regression models, it is important to choose the best suited technique based on type of independent and dependent variable , dimensionality in the data and other essential characteristics of the data.
- Data exploration is an inevitable part of building predictive model. It should be you first step before selecting the right model like identify the relationship and impact of variables
- To compare the goodness of fit for different models, we can analyse different metrics like statistical significance of parameters, R-square, Adjusted r-square, AIC, BIC and error term. Another one is the Mallow’s Cp criterion. This essentially checks for possible bias in your model, by comparing the model with all possible submodels (or a careful selection of them).
- Cross-validation is the best way to evaluate models used for prediction. Here you divide your data set into two group (train and validate). A simple mean squared difference between the observed and predicted values give you a measure for the prediction accuracy.
- If your data set has multiple confounding variables, you should not choose automatic model selection method because you do not want to put these in a model at the same time.
- It’ll also depend on your objective. It can occur that a less powerful model is easy to implement as compared to a highly statistically significant model.
- Regression regularization methods(Lasso, Ridge and ElasticNet) works well in case of high dimensionality and multicollinearity among the variables in the data set.
Citations
Footnotes
References